Silver’s Sell-Off Pauses
With indecision reigning over the last few months, is silver’s next $2 move higher or lower?
Silver has declined materially from its August highs, and we warned that higher real yields would spoil the PMs’ party. We wrote on Oct. 7, 2022:
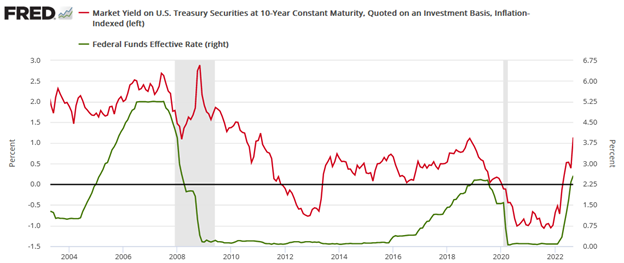
The U.S. 10-Year real yield often peaks alongside the FFR (or near it). With the Fed poised to raise the FFR by at least another 1.25% (to reach 4.5%), the U.S. 10-Year real yield should have more room to run, which is bullish for the USD Index.
Please see below:

To explain, the red line above tracks the U.S. 10-Year real yield, while the green line above tracks the FFR. As you can see, a higher FFR supports higher real interest rates. Also, when the FFR hit ~4.5% in February 2006, the U.S. 10-Year real yield reached a monthly high of 2.14%, and it occurred with a YoY CPI at roughly half the current rate.
Thus, with the prediction proving prescient, the U.S. 10-Year real yield’s surge has rattled the bulls in the recent weeks.
Please see below:

To explain, the U.S. 10-Year real yield recently surged to 2.27% and aligned with our prediction. So, the fundamentals continue to unfold as expected, and a recession should be the next fundamental catalyst to upend gold and silver.
Ominous Indicators
While higher oil prices are often deemed an indicator of economic activity, the reality is that recessions occur when oil prices are high, now low. As such, with crude jumping over $90 recently, it’s another variable that takes money out of consumers’ pockets.
Please see below:

To explain, the blue line above tracks the real Brent oil price, and the vertical gray bars represent recessions. If you analyze the three closest to the left, you can see that higher oil prices were present before/during the U.S. economy’s darkest days.
Therefore, with oil’s ascent occurring alongside rapidly rising interest rates, lower job openings, and student loan repayments restarting next week, the soft landing narrative should come under immense pressure.
To that point, job openings on Indeed hit cycle lows on Sep. 28, and as higher long-term rates suppress demand, the downtrend should continue.
Please see below:

To explain, the black and gray lines above track U.S. and Canadian job postings on Indeed. If you analyze the right side of the chart, you can see that both are heading lower, with Canada underperforming the U.S. And with higher long-term rates present across North America, the trend continues to head in the wrong direction.
In addition, Jefferies downgraded consumer apparel stocks on Sep. 25, as student loan repayments will further degrade consumers’ spending power. And with less money to allocate to discretionary items, the current backdrop is much different than 2021/2022, in our opinion.
Please see below:

To explain, Jefferies surveyed student loan borrowers, and found that roughly 40% to 50% plan to cut their spending on things like electronics, travel and apparel. As such, a confluence of factors has collided, making the economic outlook extremely unfriendly, and a Minsky Moment should help push the USD Index to new highs.
Finally, world trade volume has peaked and begun its move lower, which further highlights why demands’ best days are in the rearview.
Please see below:

To explain, world trade volume (the blue line) has dipped to its lowest level since October 2021, while the YoY percentage change (the orange line) has gone negative. If you analyze the vertical red shaded areas, you can see that similar developments preceded the last three recessions. As a result, optimism should turn to pessimism in the months ahead.
Overall, the fundamentals remain aligned with our thesis, and recession momentum has picked up despite the cheerful narrative. Moreover, while the S&P 500 suffered a sharp correction, the crowd assumes that higher rates are the primary concern when history shows the worst sell-offs occur when the Fed cuts the FFR (recession arrives). Thus, we think risk assets, like the PMs, should confront major fundamental hurdles over the medium term.
To stay prepared, subscribe to our premium Gold Trading Alert. The fundamentals are only half the battle, and the technicals are the best tools for identifying short and long-term support and resistance levels and managing risk. Furthermore, the profit potential in our current position is robust, as our indicators have been immensely accurate over the last several months.
Alex Demolitor
Precious Metals Strategist